Eventually Consistant Performance
Wow it’s been a while since I wrote anything.
Today at work I was reminded about a few different technologies and pieces of advice that I just take for granted because of the people I work around; and today these came together to form a bit of awesomeness I felt like sharing.  For a particular client we built a high performance node.js API that drives their mobile application.  One of the technologies that powers it is a Riak cluster that we put together to provide a highly available and highly scalable data store for it.
The first is SSDs.
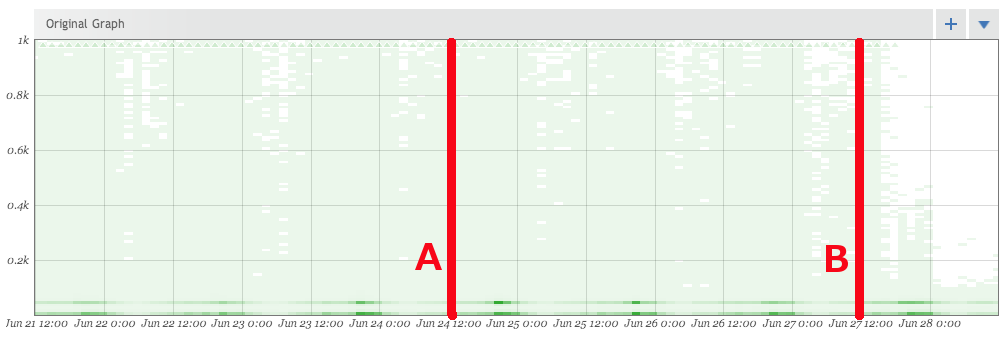
Artur Bergman gives a great rant on why you should just shut up and buy SSDs but at the time we put the cluster together we just couldn’t get them anywhere so we used some fast traditional drives. Â We recently had a chance to upgrade these nodes onto systems with SSDs as part of a move to a new location in our datacenter. Â To do this without downtime we added all the new nodes into the existing Riak cluster at line A in the graph. Â This took our cluster from 5 nodes to 11. Â This was a mixture of the old and new. Â At line B we started removing the old nodes down to the six new nodes with SSDs. Â The difference is pretty dramatic, especially once Riak had finished moving everything over. Â What you see here is a histogram of the response times for PUTs into Riak. Â Basically how long it takes to write data into the datastore.
The second is monitoring
The above graphic isn’t from Riak.  It’s actually from our API.  The API measures how long every backend call it makes takes, be it from Riak, or any of the rest of the myriad backend services.  That’s right, _every_ request.  We aggregate them, and push them out to Circonus which handles this huge volume of data and graphs it, and alerts us if something is wrong.  My coworker Brian Bickerton has even done a write up on how we do this.
The third is better monitoring
Monitoring isn’t a new topic. Â Neither is testing. Â But people can’t seem to do either of them well. Â The graphic earlier is a histogram of the data points. Â Separating your data into “buckets” so that you can see where it falls. Â The darker areas mean more items fall into that bucket. Â I can mouse over any time period to get a more detailed view.
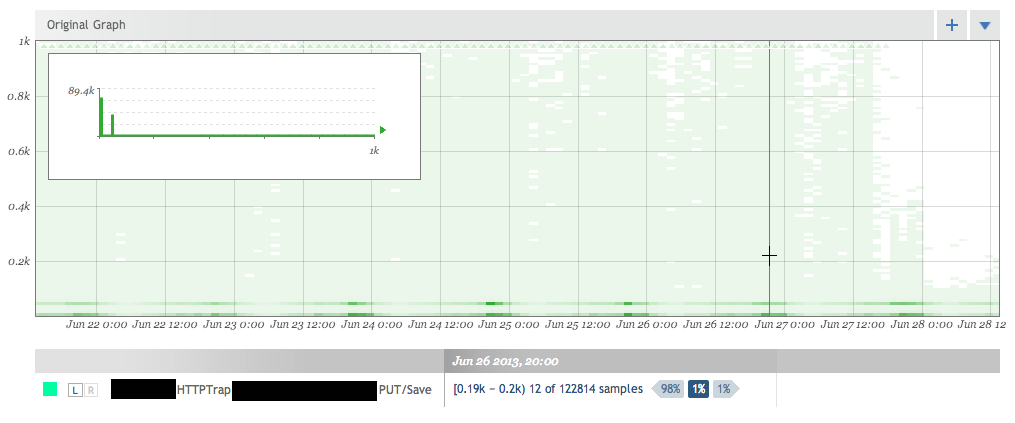
So what this is showing me is that at my cursor 98% of the data is less than where my cursor is, 1% is at my cursor, and 1% is larger. Â This is out of the 122,814 samples that were taken during that time period. Â So I can tell the we’ve made a huge impact in reducing the worst case situations for our users. Â This is actually a really important segment of users that often gets overlooked. Â It’s important to optimize the common case but if you’re one of the 1% of those users outside of it, it really sucks. Â Here we’ve shown our worst case writes going from a full second to less than 200ms. Â But it also shows why histograms are important. Â Let’s look at that same time period with the AVERAGE response time overlayed. Â And we’ll cap the graph at 200ms to show things clearer.
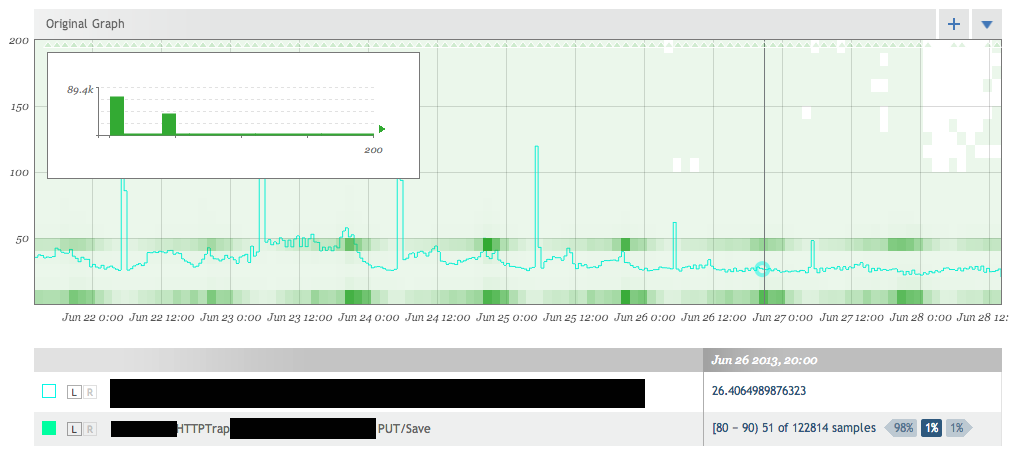
The light blue average line shows some really interesting information.  Notice how the average response time goes up each night.  This is when the backups are happening.  We can see how with the SSDs we no longer take any performance hit during the backups.  But it also shows us how much information we’re missing by only looking at an average.  Our basic use-case performance hasn’t really changed that much.  We were around 30-50ms before and now we seems to stay at around 25ms.  A nice gain, but from a user’s perspective 20ms is not noticeable  We would have no idea about the 1-2% of our users that were getting really horrible 200+ms performance.  However these users will notice.  The histogram also shows that our normal use cases seems to separate into two different operation types.  One that takes < 10ms and another take takes 40-50ms.
It’s really important to be able to tell the difference between theory and reality and to be able to make decisions based on real concrete data; and even more important to be able to measure those decisions to make sure they were right. Â Monitoring at all levels of your stack provides this and lets me say with confidence:
Just buy the SSDs already.